^z6th October 2023 at 8:57am
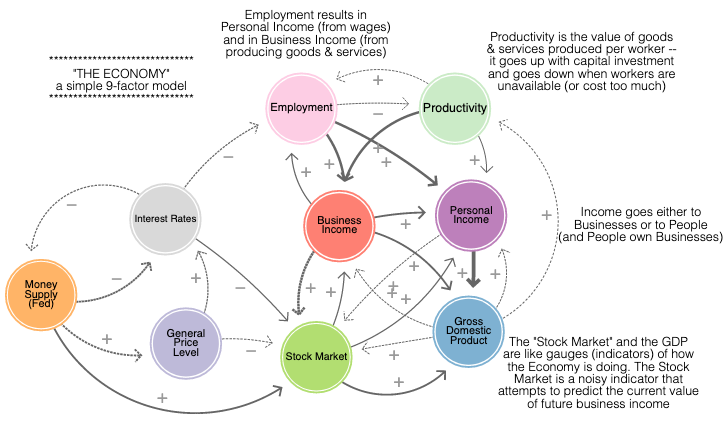
Causal flow diagrams can illustrate complex relationships among multiple drivers and can suggest archetypal system patterns. For instance, this cartoon of nine factors in a modern national economy shows a hypothesis about how boom-and-bust cycles might emerge. The nodes Money Supply, Interest Rates, and General Price Level appear to be in an unstable loop. In the short term the stock market tends to benefit from money supply increases – but that results in long term increases in interest rates and prices, which then hurt the stock market. It could all be part of a "Fixes that Fail" archetype.
(sketch thanks to LOOPY, an ultralight tool for systems thinking ©2021 MITRE Corporation ...) - ^z - 2021-09-14